- 您现在的位置:买卖IC网 > Sheet目录475 > MC13850-900HEVK (Freescale Semiconductor)IC MC13850_900_HIIP3_EVK
�� �
�
�Scattering� and� Noise� Parameters�
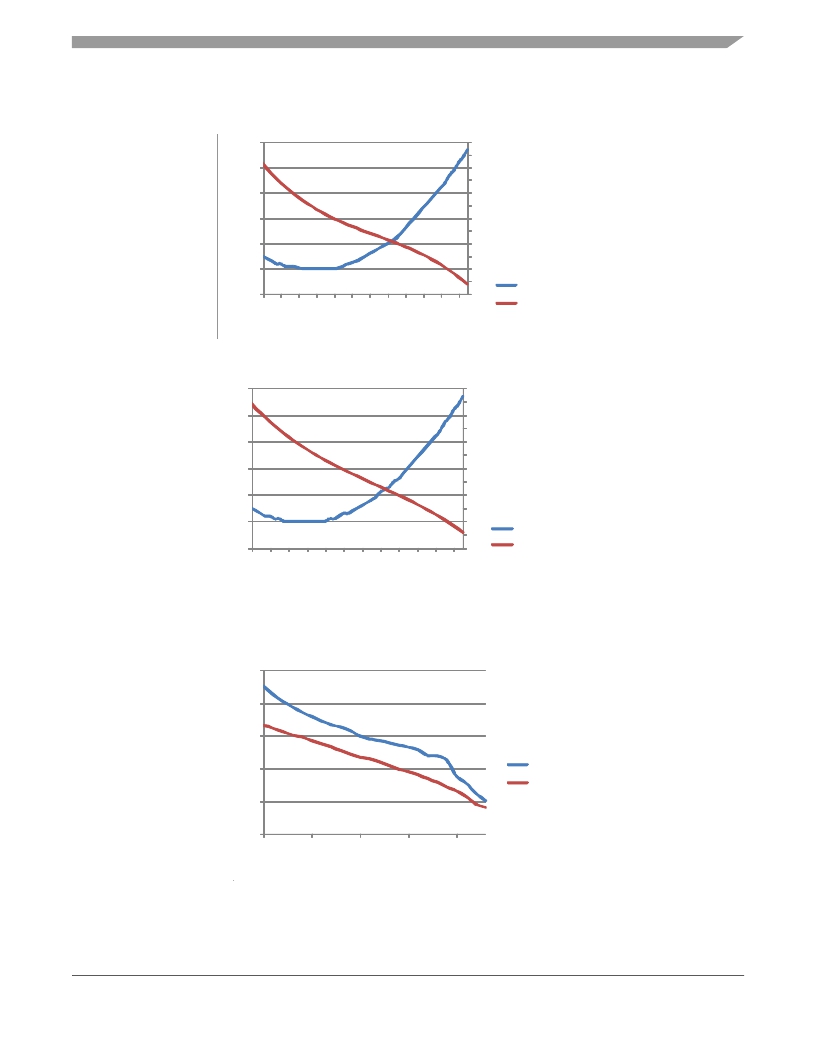
�Figure� 10� and� Figure� 11� show� minimum� noise� figure� and� associated� gain� swept� over� frequency� for�
�packaged� parts� in� a� 50� Ω� system.�
�1.4�
�1.3�
�1.2�
�1.1�
�1�
�0.9�
�32�
�30�
�28�
�26�
�24�
�22�
�20�
�18�
�16�
�14�
�12�
�0.8�
�0.3� 0.5� 0.7� 0.9� 1.1� 1.3� 1.5� 1.7� 1.9� 2.1� 2.3� 2.5�
�10�
�8�
�Fmin� ?� (dB)�
�Associated� ?� Gain� ?� (dB)�
�Frequency� ?� (GHz)�
�Figure� 10.� Minimum� Noise� Figure� and� Associated� Gain� vs.� Frequency� (Low� IP3� Mode)�
�1.6�
�1.5�
�1.4�
�1.3�
�1.2�
�32�
�30�
�28�
�26�
�24�
�22�
�20�
�18�
�16�
�14�
�1.1�
�1�
�12�
�10�
�8�
�Fmin� ?� (dB)�
�Associated� ?� Gain� ?� (dB)�
�0.3� 0.5� 0.7� 0.9� 1.1� 1.3� 1.5� 1.7� 1.9� 2.1� 2.3� 2.5�
�Frequency� ?� (GHz)�
�Figure� 11.� Minimum� Noise� Figure� and� Associated� Gain� vs.� Frequency� (High� IP3� Mode)�
�Figure� 12� and� Figure� 13� show� maximum� stable/available� gain� and� forward� insertion� gain� swept� over�
�frequency� for� packaged� parts� in� a� 50� Ω� system.�
�30�
�25�
�MSG�
�20�
�15�
�|S21� 2� |�
�MAG�
�MSG/MAG� ?� (dB)�
�|s21|^2� ?� (dB)�
�10�
�5�
�0.3�
�0.8�
�1.3�
�1.8�
�2.3�
�Frequency� ?� (GHz)�
�Figure� 12.� Maximum� Stable/Available� Gain� and� Forward� Insertion� Gain� vs.� Frequency� (Low� IP3� Mode)�
�MC13850� Advance� Information,� Rev.� 1�
�Freescale� Semiconductor�
�33�
�发布紧急采购,3分钟左右您将得到回复。
相关PDF资料
MC13851-2400EVK
IC MC13851 EVB 2400MHZ
MC13852-900EVK
IC MC13852 EVB 900MHZ
MC13917-900EVK
IC MC13917_900_EVK
MC1496P1
IC MODULATOR/DEMODULATOR 14-DIP
MC33493MOD868EV
BOARD EVAL MC33493 TANGO
MC33591MOD315EV
BOARD EVAL MC33493 TANGO3 RF
MC33593MOD868EV
BOARD EVAL MC33593 ROMEO2 RF
MC33690DWER2
IC STAND ALONE TAG READER 20SOIC
相关代理商/技术参数
MC13850EP
制造商:FREESCALE 制造商全称:Freescale Semiconductor, Inc 功能描述:Low Noise Amplifier with Bypass Switch
MC13850EPR2
功能描述:射频放大器 Monaco-Single Band LNA RoHS:否 制造商:Skyworks Solutions, Inc. 类型:Low Noise Amplifier 工作频率:2.3 GHz to 2.8 GHz P1dB:18.5 dBm 输出截获点:37.5 dBm 功率增益类型:32 dB 噪声系数:0.85 dB 工作电源电压:5 V 电源电流:125 mA 测试频率:2.6 GHz 最大工作温度:+ 85 C 安装风格:SMD/SMT 封装 / 箱体:QFN-16 封装:Reel
MC13851
制造商:FREESCALE 制造商全称:Freescale Semiconductor, Inc 功能描述:General Purpose Low Noise Amplifier with Bypass Switch
MC13851-1575EVK
功能描述:射频开发工具 MC13851_1575_EVK RoHS:否 制造商:Taiyo Yuden 产品:Wireless Modules 类型:Wireless Audio 工具用于评估:WYSAAVDX7 频率: 工作电源电压:3.4 V to 5.5 V
MC13851-1960EVK
功能描述:射频开发工具 MC13851_1960_EVK RoHS:否 制造商:Taiyo Yuden 产品:Wireless Modules 类型:Wireless Audio 工具用于评估:WYSAAVDX7 频率: 工作电源电压:3.4 V to 5.5 V
MC13851-2140EVK
功能描述:射频开发工具 MC13851_2140_EVK RoHS:否 制造商:Taiyo Yuden 产品:Wireless Modules 类型:Wireless Audio 工具用于评估:WYSAAVDX7 频率: 工作电源电压:3.4 V to 5.5 V
MC13851-2400EVK
功能描述:射频开发工具 MC13851 EVB 2400MHZ RoHS:否 制造商:Taiyo Yuden 产品:Wireless Modules 类型:Wireless Audio 工具用于评估:WYSAAVDX7 频率: 工作电源电压:3.4 V to 5.5 V
MC13851EP
制造商:FREESCALE 制造商全称:Freescale Semiconductor, Inc 功能描述:General Purpose Low Noise Amplifier with Bypass Switch